Data Analysis of the Allegheny Observatory All Sky Camera Images
William Qiu
Civil and Environmental Engineering
This research project’s goal was to analyze 10 years of All Sky camera footage from the Allegheny Observatory in Pittsburgh, PA and determine if the sky got brighter in Pittsburgh between 2010 to 2020. The way that this was done was by using a computer program to automatically search through the images and extract data in the form of exposure times written on each image and the color of pixels in the center of each image. A plot showing the change in exposure times over 10 years could help answer the question, as well as a timeline showing the color of the sky changing. However, the program struggled to accurately detect the text, especially when it was brighter out, as the brighter background became harder to contrast with the white text. As a result, we could no longer quantitatively measure the brightness of the Allegheny sky through exposure times.
The code for the program can be found at the following site: https://pastebin.com/s1JgHEm8. To use the code, the Tesseract module and Python Imaging Library (PIL) must be installed through pip, conda, or another installation software. The PIL image library must also be installed to a folder that you can direct the code to. The CSV module and Turtle library come built-in with Python. The timeline of the colors in the center of the images is shown in figure 1 and contains 314 images.
Figure 1.
This is a relatively linear timeline, meaning that photos taken in 2015 are at about the middle of the timeline and other years can be found equally spaced apart. There are periods of bright images, indicated by the bright bands, and periods of dark images, indicated by the darker bands. Because of the varying bands and the overall trend in colors, the timeline does not show the sky becoming brighter or darker during the past 10 years. As will be discussed later, however, there could be a number of reasons for why the timeline looks this way.
One of my roles during this project was to look at the All Sky camera images and pick out the ones to analyze. However, my research partner, Claire Su, and I decided to split up the image work by assigning each of us five years to analyze instead. I was assigned the 2016 to 2020 images while she was assigned the 2010 to 2015 images. When looking through the images, I tried to pick those that were within 1 to 2 days of the new moon in October and as close to 1 to 2 A.M. as possible. After making sure that about 10 of them are clear enough, I would add them into their respective folder for collection.
My second role was to create a program that can automatically analyze the images. This task required a lot of research toward how difficult it would be and what tools I should use. I eventually decided on using Python to write the code, the python-tesseract tool to extract the text from the images, PIL to find the RGB color values of the images, and the turtle python library to create colored rectangles for the timeline. Along with this, I had to download all of the selected images that we had chosen and collect them all in a folder for the program to run through.
My experience working on the project was that it was a very fun and interesting experience that made me really want to learn more about automating data analysis. When I first started planning and researching, I felt a little daunted by the thought of having to go through over a million photos and somehow get data from them to eventually create a way to visualize the change in brightness. However, the more I researched, the more I realized that this would very likely have to be automated. Something that had always interested me was programming and while my knowledge in programming was limited to a beginner class’ worth, I found it very enjoyable to do research on all of the different ways I could use Python and learn about the syntax. The three main Python tools that I used, Tesseract, PIL, and Turtle, all used different documentation to perform their task, all of which I had to learn. This learning experience would have been quite difficult if not for the vast amount of content on the internet available for me to scour through to learn from.
It was interesting to see what the sky looked like at all times of the day in lots of different weather conditions. When looking very quickly through the images, you could see the stars moving slowly around, which is something that I never notice when I look at the night sky. When the program produced a timeline that included dark and light gray bands and no conclusive evidence that the sky was brightening or darkening as time went on, I felt very puzzled and unsure of what my project found. It is possible that the control variables we had selected for this project limited what our project was able to search, but it is also possible that, for some reason, the cameras simply did not record the sky brightening over the 10 year period.
Throughout this project, I learned a lot about programming and using resources from both online sources and from other people. Because I had to share my code, I had to make the code easily understandable to people that may not have any knowledge about programming. This was done by organizing my code into sections for each of the different tasks and through the use of commenting to annotate what each section does. Along with this included learning more about communication. Because my partner and I were in different time zones and downloaded different years of images, it was more difficult finding a way to communicate with each other on what our project should look like and what the next steps should be. This, coupled with technical difficulties in GroupMe, taught me a lot about how important communication is when there is a very small window where both of us can work on something at the same time.
I encountered a large number of errors and problems when creating code, through which I learned a lot about problem solving and debugging. Shown in figure 2 is a sample of the lists that Tesseract extracted from a sample of photos taken in September of 2018.
Figure 2.
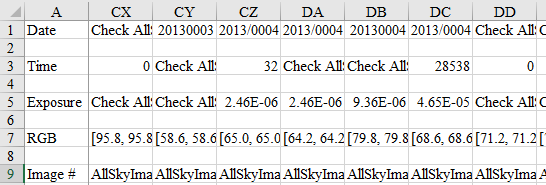
When Tesseract extracts a list of text, it may sometimes read small dust particles or empty space as spaces, mixing the important text with text like ‘ ’ or ‘ ‘. It also sometimes misreads an exposure time such as ‘11.3000s’ as ‘1130005’, which is not helpful when trying to get accurate data. To get around this, I have implemented various checks to make sure that if there is a 5 at the end, it is cut off and that if there is no decimal, it is added on. This also works for the time each photo was recorded where instead of a period, a colon is added. As seen in the photo above, Tesseract also got numbers mixed up, such as a ‘10’ being seen as ‘1’ or ‘9’ in the exposure time readings. Another error that sometimes occurs is that Tesseract will output an empty list (which looks like []) which I fixed by adding in zeros to fill in the space. Whenever there is an error detected in the program, it would have shut down completely, which means that for the program to run through all of the images uninterrupted, I would have needed to add in exceptions. However, the way that I decided to fix this problem was to make it so that if the program encountered an error, it would mark the text so that I could check the image and fill in the correct text afterward. An example of the tabled results is shown in figure 3.
Figure 3.
Unfortunately, there were so many errors that I would have needed to fill in that I did not think it would be feasible. This was a good learning experience and making a backup plan is something that I will take note of for the future.
There are many ways that this project could be improved upon, the first of which is to use optical character recognition tools to reliably extract data from the cameras. The biggest issue that this part of the project had was that Tesseract was not reliable enough for this and often missed or misread letters/numbers. However, if Python was able to direct Tesseract to only look at the top left of the images, which is where all of the text was, it could potentially reduce the number of errors and increase the accuracy of the readings. To improve the efficiency and readability of the program, someone with better programming skills could find faster ways for the program to run through each of the images to shorten the time it takes to get results. To create a timeline of RGB colors, a better tool than Python Turtle could be used because when given 314 images, it takes about 9 minutes to finish drawing the rectangles of color, which is a big problem when looking through a large number of images.
While we decided to only pick about 30 images that were within 1-2 days of the new moon in October, adding in more images would have been beneficial and made the data more representative of the brightness in Pittsburgh. This could have been through increasing the range of days from 1 to 4 days and also could have been through increasing the range of time the images were taken, from between 1 to 2 A.M. to maybe 12 to 3 A.M. If this project had a longer timeline, it could have been possible to manually correct all of the extracted data.
Another recommendation that I would make is to find the average RGB color values for October of each year, instead of finding the average RGB color values for each night. This change would make the timeline less susceptible to outliers and could reduce the number of dark or light bands. The timeline was created by drawing a rectangle for each image which leads to the possibility that the dark bands were actually outliers.
Research Timeline:


